up-arrow
arrow_back

Indo-US Equity Solution

Indo-US Equity Solution

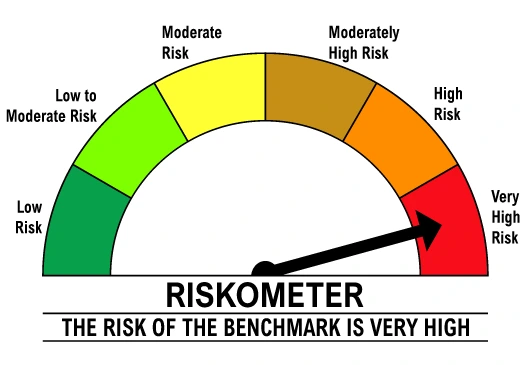
Benchmark: S&P BSE Smallcap TRI info icon

96.25 lakh people have invested in this fund

View performance details

Return:

This solution

%

S&P BSE Smallcap TRI

%

Gold

%

Invested

Earning

This solution

18.00%

S&P BSE Smallcap TRI

%

Gold

%

This solution allows you to access the biggest developed equity market in the world (USA) and one of the fastest growing emerging markets in the world (India) simultaneously. This style of investing diversifies your risk for a number of reasons. First, because business cycles in developed and emerging markets are different, you are shielded from an economic downturn in any one country. Second, you are shielded from a risk of loss when there are changes to the political leaders or policies in any one country. Third, you are shielded from a reduction in the value of the Rupee over time. When the value of the Rupee falls against the US Dollar, the value of the US equity fund rises proportionally.
Funds in the solution

DSP Equity Opportunities Fund
  • Growth
  • Equity
  • Large-cap

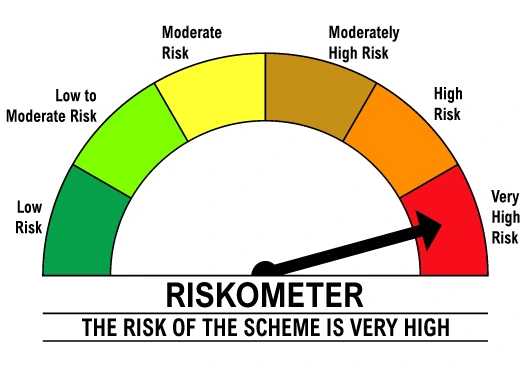
Risk factor:

Very High Risk info

  • 50%

  • Share info

DSP Mid Cap Fund
  • Growth
  • Equity
  • Mid-cap

Risk factor:

Very High Risk info

  • 25%

  • Share info

DSP Banking & PSU Debt Fund
  • Growth
  • Debt

Risk factor:

Very High Risk info

  • 15%

  • Share info

DSP Ultra Short Fund
  • Growth
  • Equity
  • Large-cap

Risk factor:

Very High Risk info

  • 10%

  • Share info

Risk

Sudden and steep downsides that may take up to a few years to recover

Goal of Investment

Long term wealth creation

Ideal holding period

Over 7 years

Past Returns

15.99%

10 years

22.55%

5 years

15.65%

3 years

22.48%

1 year


Fund managers

Vinit Sambre

Vinit Sambre

Managing DSP Small Cap Fund in this solution.

arrow_forwardSee funds managed by him

arrow_forwardSee his investing philosophy

Resham Jain

Resham Jain

Managing DSP Small Cap Fund in this solution.

arrow_forwardSee funds managed by him

Jay Kothari

Jay Kothari

Managing DSP US Flexible Equity Fund of Fund in this solution.

arrow_forwardSee funds managed by him

Compare Performance

Chart type

Invested as

Invested Amount

Invested since

This Solution

Vs

S&P BSE Smallcap T

Gold

PPF

NA
Funds Annual returns Current Value Absolute Growth
  • There is no guarantee that investors goals will be met.
  • Scheme(s) referred in above chart are schemes of DSP Mutual Fund.
  • The above basket of portfolios are given only for investor's convenience and Investor can invest in the individual scheme(s) as well. The portfolios are created without reference to any individual investor's risk appetite/ their financial needs/ goals etc. and Investors should consult their mutual fund distributors or tax advisors before selecting the said portfolio. The portfolio(s) do not guarantee achievement of any goal or targeted/assured returns. For detailed information on individual scheme, investors are requested to read Scheme Information Document of relevant scheme available on www.dspim.com.
  • The returns chart for the portfolio is plotted based on initial investment as per the allocations specified. The portfolio will undergo rebalancing to initial allocations as & when the allocations bust 10% thresholds. For example, if allocation to specific scheme is 50% then rebalancing will trigger when the allocation to the said scheme as per current market value on that specific day busts 55%. This rebalancing is done to ensure portfolio stays true to the initial objective at the time of investment. The exit load & tax impact, if any, at the time of rebalancing aren't accounted in the returns chart. Also, to prevent frequent rebalancing due to market volatility, rebalancing events are limited to once in a year. For example, if the last rebalance event has been executed on Jan 1, 2018 then no further rebalancing will happen prior to Jan 1, 2019 even if the 10% thresholds defined for rebalancing are breached.
  • Past performance may or may not be sustained in future and should not be used as a basis for comparison with other investments. For performance in SEBI prescribed format click on the scheme names mentioned above under "Schemes in this solution"
  • For lumpsum investments, if the investment period is less than 1 year then same return values are displayed for absolute & XIRR. For periods above 1 year, they are annualized. 1 Year is assumed as 365 days.
  • Returns for investments in income distribution cum capital withdrawal (IDCW) plans of schemes are calculated after assuming that the net income distribution cum capital withdrawal (IDCW) payouts post statutory taxes & levies, are re-invested back in the scheme.
  • For SIP returns chart, the start day for SIP investments is considered as 1st of every month. There is no end date to SIPs for the purpose of graphs.
  • For the purpose of NAV date applicability, if the investment date happens to be a non-business day, next business day's NAV is applied. Investment on inception date can happen on a non-business day.
  • Gold prices are available post 29 JAN, 2005 & are based on daily closing values on MCX.
  • PPF interest rate is assumed at 8.7% p.a. & interest received is compounded daily for the returns illustration in the charts.

Solution Details

Solution Details

Solution Description

This solution allows you to access the biggest developed equity market in the world (USA) and one of the fastest growing emerging markets in the world (India) simultaneously. This style of investing diversifies your risk for a number of reasons. First, because business cycles in developed and emerging markets are different, you are shielded from an economic downturn in any one country. Second, you are shielded from a risk of loss when there are changes to the political leaders or policies in any one country. Third, you are shielded from a reduction in the value of the Rupee over time. When the value of the Rupee falls against the US Dollar, the value of the US equity fund rises proportionally.

Minimum Investment

DSP Small Cap Fund

View details
DSP Small Cap Fund

DSP US Flexible Equity Fund of Fund

View details
DSP US Flexible Equity Fund of Fund

BSE 250 Small Cap TRI

Benchmark of DSP Small Cap Fund

BSE 250 Small Cap TRI

Russell 1000 TR Index

Benchmark of DSP US Flexible Equity Fund of Fund

Russell 1000 TR Index
  • DSP Solutions is not, in any manner an assurance or promise or guarantee on part of DSP Mutual Fund / DSP Asset Managers Private Limited AMC to the unit holders in terms of returns or capital appreciation or minimization of loss of capital.
  • DSP Solutions is a feature of the platform provided by the Mutual Fund and not of the scheme. The AMC reserves the right to make changes to this model as may be necessary and as it may deem fit.
  • DSP Solutions is an Investment solution which is being offered through this platform is similar to a cart journey (i.e. which support an investor to have a multiple scheme in the basket) in a single purchase order during their normal purchase journey. The basket of certain selected schemes are given only for Investors convenience which is completely optional and Investor can invest in the individual scheme(s) digitally also. The amount to be invested in the scheme is configured as per the pre-defined percentage for each solutions which is being offered in the platform, for which the investor is well aware and can help an Investor to rely on their own experience while selecting the baskets suitable to them. The investments made in the scheme(s) through baskets (i.e. purchase) / redemption or any other transactions are treated at par with individual scheme transactions. The readymade baskets are for subscription in multiple schemes with minimal clicks. Investors can redeem the desired units from any scheme at any time without any conditions or restrictions other than those applicable as per the SID of the respective scheme.
  • The investment approach / framework/ strategy mentioned herein are currently followed by the scheme and the same may change in future depending on market conditions and other factors within the boundaries as defined in Scheme information Document.
  • The user(s) before acting on any information herein should make his/their own decision and seek appropriate professional advice.
  • For complete details on investment objective, investment strategy, asset allocation, scheme specific risk factors and more details, please read the Scheme Information Document, and Key Information Memorandum of the scheme available on ISC of AMC and also available on www.dspim.com