up-arrow
arrow_back

DSP Top 100 Equity Fund

DSP Top 100 Equity Fund

share icon

Benchmark: BSE 100 (TRI) info icon

2.48 lakh people have invested in this fund

View performance details

Return:

This fund

18.00%

BSE 100 (TRI)

14.30%

NIFTY 50 TRI

14.15%

Invested

Earning

This fund

18.00%

BSE 100 (TRI)

14.30%

NIFTY 50 TRI

14.15%

team 2.48 lakh people have invested in this fund as of

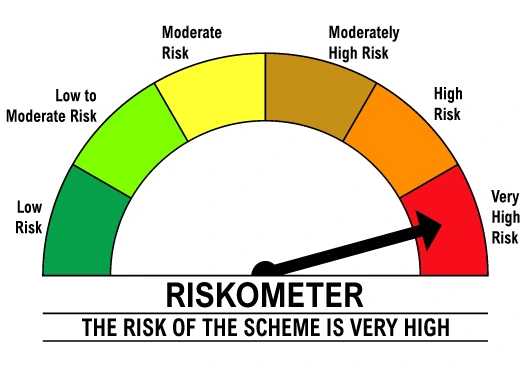
This is an Equity Diversified, Large cap fund with BSE 100 (TRI) as its benchmark. The risk level for this fund is categorized as Very High Risk.

Total AUM

4,504.42 crores as of Dec 31, 2024

Age of Fund

21 years 10 months since Mar 10, 2003

Expense Ratio

1.93% as of Jan 14, 2025

Exit Load

1% upto 12 Months

Ideal holding period

10 Years+

Holdings

as of Dec 31, 2024

HDFC Bank Limited

9.63%

ICICI Bank Limited

9.46%

Mahindra & Mahindra Limited

5.76%

ITC Limited

5.67%

Bajaj Finance Limited

5.20%

Cipla Limited

4.23%

Axis Bank Limited

4.19%

Large Cap

88.80%

Small Cap

6.40%

Mid Cap

5.00%

Banks

34.00%

Automobiles

13.20%

Pharmaceuticals & Biotechnology

11.30%

Finance

7.90%

It - Software

7.60%

Rolling Returns

Bars show distribution of returns in given range for selected time period.

View performance details

Things to know before you invest

add remove

What is in DSP Top 100 Equity Fund?

  1. Top 100 Equity Fund invests in companies from among the top 100 in India- large, well known leaders in their respective sectors.
  2. These companies have proven business models with solid track records of performance.
  3. Fund can have very high active share compared to benchmark thereby return profile can be materially different from benchmark.
  4. Among DSP's oldest equity funds with a 18 year+ track record.
  1. This is a smart way to own sector-leading companies with proven business models, & good track records.
  2. Offers the potential to grow your wealth by owning a quality portfolio of businesses.
  3. Can help you beat the impact of rising prices over the long-term.
  4. Can be a suitable choice for your core portfolio.
  1. Consider this fund if you
    • Are a first-timer or a relatively new equity market investor.
    • Have the patience & mental resilience to remain invested for a decade or more.
    • Recognize market falls as good opportunities to invest even more.
    • Accept that equity investing means exposure to risk.
    • Do not chase the highest possible returns at all times.
  1. Top 100 Equity fund carries Very High Risk.
  2. Expect short term return fluctuations, especially during periods of market ups & downs.
  3. Recommend investing via SIP over a long term (7 yrs+).
  4. This fund can underperform its benchmark in the short term (<3yrs).

Fund managers:

Abhishek Singh

Abhishek Singh

Total work experience of 18 years. Managing this fund since June 2022.

arrow_forwardSee funds managed by him

arrow_forwardSee his investing philosophy

Portfolio

Prescribed asset allocation: 80% - 100% Equity & equity related instruments of large cap companies , 0% - 20% Other equity & equity related instruments , 0% - 20% *Debt and Money Market Securities , 0% - 10% Units of REITs & InvITs

Current Allocation

as of Dec 31, 2024

Top holdings

HDFC Bank Limited

9.63%

ICICI Bank Limited

9.46%

Mahindra & Mahindra Limited

5.76%

ITC Limited

5.67%

Bajaj Finance Limited

5.20%

Allocation by Market Cap

Large Cap

88.80%

Small Cap

6.40%

Mid Cap

5.00%

Top Sectors

Banks

30.99%

Automobiles

12.01%

Pharmaceuticals & Biotechnology

10.31%

Finance

7.18%

It - Software

6.95%

Top holdings

No Data to display

Top holdings

TREPS / Reverse Repo Investments

8.94%

Cash & cash equivalents

-0.21%

Credit rating profile

Cash & Equivalent

99.60%

Instrument break-up

TREPS

100.00%


Indicators

Portfolio turnover ratio

0.36 last 12 months

Compare Performance

Performance highlights over last

for

investment

Cumulative returns on

Annual returns

Current value

Min CAGR:
MedianCAGR:
Max CAGR:

Good Returns

return card icon

Negative Returns

return card icon

vs Category

return card icon

vs Benchmark

return card icon

  • Historical Returnsas of with investment of10,000

This fund BSE 100 (TRI) ^ NIFTY 50 TRI #
CAGR Current Value CAGR Current Value CAGR Current Value

Income distribution Cum Capital Withdrawal (IDCW) Distributed

Record Date IDCW per unit NAV Before NAV After

Chart type

Invested as

Invested Amount

Invested since

This fund

Vs

BSE 100 (TRI)

NIFTY 50 TRI

Gold

PPF

Funds Annual returns Current Value Absolute Growth

Chart type:

Invested as

Invested Amount

Invested period

Funds Minimum Median Maximum % times -ve returns % times returns > 7%

Date of allotment: Mar 10, 2003.

Period for which fund's performance has been provided is computed based on last day of the month-end preceding the date of advertisement

Different plans shall have a different expense structure. The performance details provided herein are of Regular Plan.

Since inception returns have been calculated from the date of allotment till June 30, 2021

Past performance may or may not be sustained in future and should not be used as a basis for comparison with other investments

Rolling returns have been calculated based on returns from regular plan growth option.

^ Fund Benchmark # Additional Benchmark

Fund Details

Fund Details

Investment Objective

The primary investment objective is to seek to generate long term capital appreciation from a portfolio that is substantially constituted of equity and equity related securities of large cap companies. From time to time, the fund manager will also seek participation in other equity and equity related securities to achieve optimal portfolio construction.
There is no assurance that the investment objective of the Scheme will be realized.

Fund Type

Equity – Diversified
Large-cap

An open ended equity scheme predominantly investing in large cap stocks

Riskometer

Level of Risk in the fund

View details
Riskometer

Minimum Investment

Rs.  100 Lumpsum
Rs.  100 SIP– 12 instalments
Rs.  100 Minimum Additional Purchase

FAQs

FAQs

Click on the performance section to see the returns of the DSP Top 100 Equity Fund. You can check both lump sum and SIP returns. We have shown how DSP Top 100 Equity Fund has performed versus its benchmark index (BSE 100 TRI) and its additional benchmark (Nifty 50 TRI) over last 1, 3, 5 years and since inception. One should always evaluate an equity fund's performance over long investment periods.

Net Asset Value (NAV) of a fund is the closing market value of the underlying securities of the fund less expenses and liabilities divided by the total number of units outstanding. You can check the NAV of DSP Top 100 Equity Fund by clicking on this link. Please note that the NAV of the fund will change on a daily basis. The NAV at which you can buy / redeem units of DSP Top 100 Equity Fund depends on when we received your purchase or redemption request. If we receive your purchase / redemption request before 3pm on a working day, you will get the same day NAV. If we receive it after 3pm, you will get the following days NAV.

Click on the green INVEST button on the left hand side of the webpage. If you are an existing DSP MF, you can start investing straightaway. If you an existing Mutual Fund investor but new to DSP MF, you will have create a folio by filling out the necessary details. If you are new to Mutual Funds, you will have to fulfil KYC requirements. Follow the on-screen instructions to get started.

Expense ratio is the percentage of the fund?s asset to cover expenses like administration, management, marketing etc. You can check the expense ratio of DSP Top 100 Equity Fund by clicking on this link. The TER of DSP MF?s schemes are in accordance with SEBI's regulations (see the table below, optional).

Assets under Management Maximum TER
For Equity Funds For Debt Funds
On the first Rs. 500 crores 2.25% 2.00%
On the next Rs. 250 crores 2.00% 1.75%
On the next Rs. 1,250 crores 1.75% 1.50%
On the next Rs. 3,000 crores 1.60% 1.35%
On the next Rs. 5,000 crores 1.50% 1.25%
On the next Rs. 40,000 crores TER reduction of 0.05% for every increase of Rs 5,000 crores of daily net assets or part thereof. TER reduction of 0.05% for every increase of Rs 5,000 crores of daily net assets or part thereof.
Above Rs. 50,000 crores 1.05% 0.80%

DSP Top 100 Equity Fund is an open ended fund. You can redeem units of the fund at any time. However, exit load may apply if you are redeeming within the exit load period. The process for redeeming your investments in DSP Top 100 Equity Fund is very simple. If you have invested directly, then you should login to www.dspim.com/invest/ and click on redeem. Choose DSP Top 100 Equity Fund and enter the number of units or amount. Enter the OTP and click on continue. Your redemption will be processed as per due procedures.

Assets under Management or AUM are the market value of all the investments managed by the fund. You can check the AUM of DSP Top 100 Equity Fund by clicking on this link.

Click on the portfolio section. You will see the Top 5 holdings of the fund. Click on the button below to see all the holdings.

Click on the portfolio section. You will see the Top 5 sectors the fund has invested on the right hand side of the page.

The PE ratio of the DSP Top 100 Fund or any other aggregative valuation metric is not a target but an outcome of the bottom up stock selection of the fund manager. You can check the PE ratio of the fund in the Fund Presentation under Fund Documents. Please note that the underlying portfolio is same for Direct and Regular Plans, and for Growth and IDCW options.

team 2.48 lakh peoplehave invested in this fund as of