2.64 lakh people have invested in this fund
2.64 lakh people have invested
in this fund as of
Total AUM
₹5,070.17 crores
as of Mar 31, 2025
Age of Fund
12 years 3 months since Jan 01, 2013
Expense Ratio
0.97%
as of Apr 11, 2025
Exit Load
1%
upto 12 Months
Ideal holding period
10 Years+
Top holdings
ICICI Bank Limited
9.10%
HDFC Bank Limited
9.07%
ITC Limited
5.52%
Mahindra & Mahindra Limited
5.00%
Axis Bank Limited
4.91%
Allocation by Market Cap
Large Cap
89.50%
Small Cap
5.80%
Mid Cap
4.90%
Uncategorized
0.10%
Top Sectors
Banks
Automobiles
Pharmaceuticals & Biotechnology
Finance
Insurance
Top holdings
No Data to display
Top holdings
TREPS / Reverse Repo Investments
12.81%
Cash & cash equivalents
-0.75%
Instrument break-up
TREPS
100.00%
Portfolio turnover ratio
0.28 last 12 months
Performance highlights over last
for
investment
Cumulative returns on
Annual returns
Current value
Historical Returnsas of with investment of₹10,000
| This fund | BSE 100 (TRI) ^ | NIFTY 50 TRI # | ||||
|---|---|---|---|---|---|---|
| CAGR | Current Value | CAGR | Current Value | CAGR | Current Value | |
Income distribution Cum Capital Withdrawal (IDCW) Distributed
| Record Date | Face Value | IDCW per unit | NAV Before | NAV After |
|---|
| Funds | Annual returns | Current Value | Absolute Growth |
|---|
Date of allotment: Jan 01, 2013.
Period for which fund's performance has been provided is computed based on last day of the month-end preceding the date of advertisement
Different plans shall have a different expense structure. The performance details provided herein are of Direct Plan.
Since inception returns have been calculated from the date of allotment till June 30, 2021
Past performance may or may not be sustained in future and should not be used as a basis for comparison with other investments
Rolling returns have been calculated based on returns from regular plan growth option.
Pursuant to payments of Income Distribution cum Capital Withdrawal, the NAV of the IDCW option(s) of Schemes would fall to the extent of payout, and statutory levy, if any.
^ Fund Benchmark # Additional Benchmark

Abhishek Singh
The primary investment objective is to seek to generate long term capital appreciation from a portfolio that is substantially constituted of equity and equity related securities of large cap companies. From time to time, the fund manager will also seek participation in other equity and equity related securities to achieve optimal portfolio construction.
There is no assurance that the investment objective of the Scheme will be realized.
An open ended equity scheme predominantly investing in large cap stocks
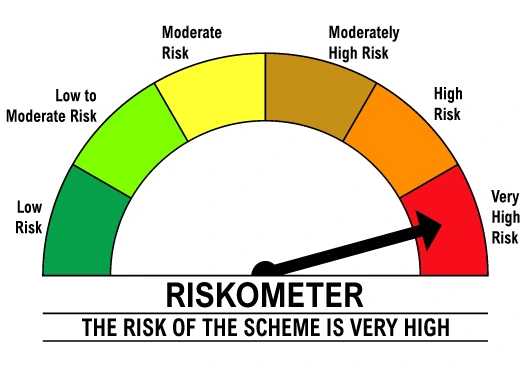
Level of Risk in the fund

Expense ratio is the percentage of the fund?s asset to cover expenses like administration, management, marketing etc. You can check the expense ratio of DSP Top 100 Equity Fund by clicking on this link. The TER of DSP MF?s schemes are in accordance with SEBI's regulations (see the table below, optional).
| Assets under Management | Maximum TER | |
|---|---|---|
| For Equity Funds | For Debt Funds | |
| On the first Rs. 500 crores | 2.25% | 2.00% |
| On the next Rs. 250 crores | 2.00% | 1.75% |
| On the next Rs. 1,250 crores | 1.75% | 1.50% |
| On the next Rs. 3,000 crores | 1.60% | 1.35% |
| On the next Rs. 5,000 crores | 1.50% | 1.25% |
| On the next Rs. 40,000 crores | TER reduction of 0.05% for every increase of Rs 5,000 crores of daily net assets or part thereof. | TER reduction of 0.05% for every increase of Rs 5,000 crores of daily net assets or part thereof. |
| Above Rs. 50,000 crores | 1.05% | 0.80% |
2.64 lakh peoplehave invested in this fund as of