Summary
This blog covers an important topic in investing, providing useful insights and practical advice for readers. It helps you make informed decisions and improve your financial strategies. This blog provides in-depth analysis and practical advice. These funds are suitable for long-term investors looking to save on taxes. They offer a unique combination of tax savings and potential for high returns over time.
Welcome to the March 2024 edition of Netra, where we present data-driven market insights that can inform your investing decisions.
This month, we’ll talk about the shrinking risk premium associated with equities, the concentration risk currently faced by the tech sector, and the implications of slowing wage growth in India.
Are stock investors getting complacent?
Equities are typically more volatile and risky than government bonds, which is why stock market investors expect to receive excess returns for investing in stocks rather than bonds. This expected premium, aptly called the equity risk premium (ERP), serves to compensate equity investors for taking on additional risk.
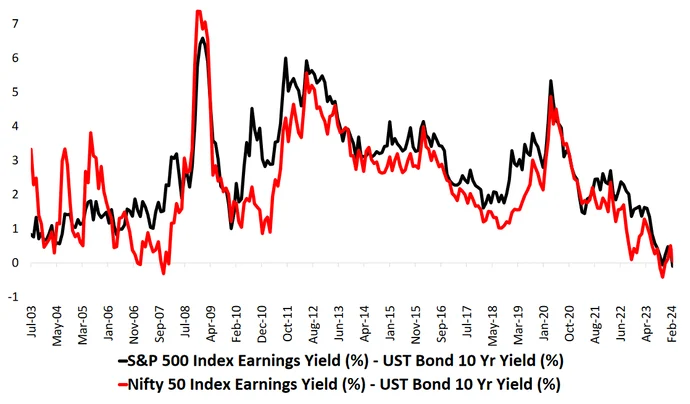
One way to capture the ERP is by looking at the difference between the earnings yields of stocks and bond yields. Calculated this way, it turns out that the ERP is currently lower than it has been in more than a decade. In fact, the last time the ERP was this low was during the market euphoria that just preceded the global financial crisis of 2008.

Source: Bloomberg, DSP; Data as of Feb 2024
What does this mean? Well, one factor that affects the ERP is the perceived level of market risk. When the perceived risk is low, investors are willing to accept a lower premium for investing in equities, which exerts a downward pressure on the ERP, and vice versa.
So the unusually low ERP levels being seen right now likely correspond to a low perceived level of risk in the stock market. But here’s the thing: there is often a mismatch between actual risk and perceived risk (as was seen prior to the 2008 crash). In addition, a lower perceived level of risk can, ironically, increase the actual level of risk, simply because the perception of lower risk makes investors more complacent.
Thus, while the current ERP levels might not be indicative of anything catastrophic, they might be a sign of a general complacency and disregard for risk, which might make lacklustre returns more likely.
The flip side of tech’s phenomenal growth: high concentration risk
Most major equity markets bounced back strongly after plummeting due to COVID in 2020. However, it’s now clear that the tech sector in particular has outshone most of the others, so much so that it now carries a hefty concentration risk.
The market cap of the Nasdaq Composite Index (which is often considered to be a stand-in for the tech sector) now represents nearly a quarter (23%) of the global equity market’s capitalisation.

Source: Bloomberg, DSP; Data as of Feb 2024
If we were to add the contributions of tech companies in China, India, the EU, and the rest of the world, the tech sector’s global share in terms of market cap goes up to nearly 40%.
No individual sector has reached such heights before. The closest a sector last came to having such a massive influence on the markets was probably in the 1980s: approximations from past data indicate that the broad energy sector might have accounted for close to a third of the global equity market’s capitalisation at some point in that decade.
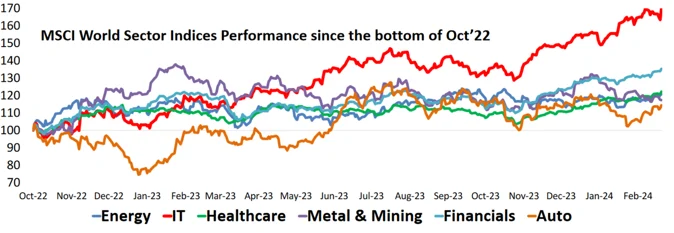
Moreover, while the IT sector has seen excellent growth over the last 18 months, the performance of most other sectors has been relatively unimpressive.

Source: Bloomberg, DSP; Data as of Feb 2024
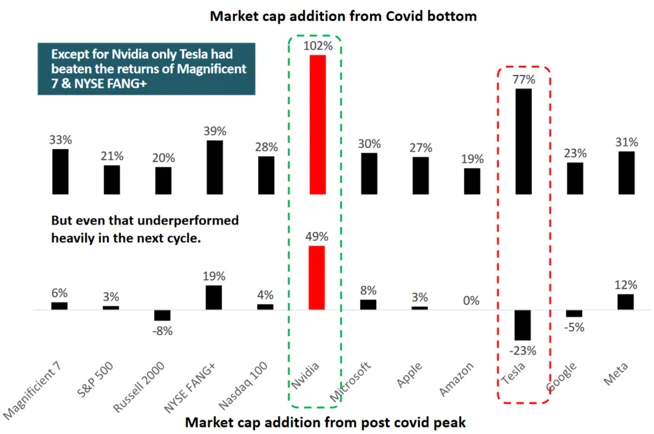
In fact, broadly speaking, only the semiconductor space and AI-related stocks have performed unusually well since November 2021. Currently, Nvidia accounts for the bulk of the returns (from the COVID bottom) of the NYSE FANG+ and Magnificent 7 cohorts, with Tesla being the second-biggest contributor. The broader market, including tech stocks, has been more subdued.

Source: Bloomberg; Data as of Feb 2024. Post covid peak here is taken as Nov 2021
Markets are strongest when they are broad and weakest when they narrow to a handful of blue-chip names.”
Thus, the dependence of the ongoing tech rally on a handful of names could be a sign of unsustainability. Investors in the sector would do well to be cautious.
Slowing wage bill growth might bode ill for non-large-caps
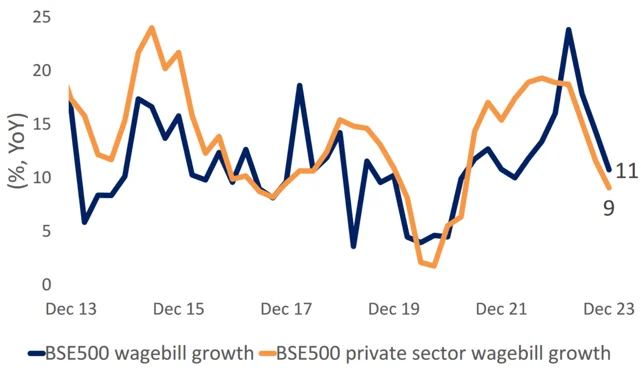
The term ‘wage bill’ refers to the total amount paid by an organisation to its employees over some specified period. A few quarters ago, the overall wage bill growth of BSE500 companies stood at 20% YoY; it has now declined to 11% YoY.
Of particular concern is the fall in the wage bill growth of private sector companies, which now stands at 9% YoY: this is a ten-year low if the impact of Covid is excluded.

Source: Capitalline, Nuvama; Data as on Feb 2024
This slowdown in wage bill growth could negatively impact small- and mid-cap (SMID) stocks. Why? Well, many SMID stocks have done well in the recent past due to their excellent profit growth, which was largely driven by significantly higher margins. But if you add the slowdown in wage bill growth to subdued core inflation and the expectations of low nominal GDP growth, then the ability of SMID companies to maintain their performance and justify their valuations gets called into question.
The bottom line
Stock market investors might currently be disregarding the actual levels of risk, which could result in disappointing near-term returns. In addition, the high-flying performance of the US tech sector might make that space look tempting, but investors need to be mindful and circumspect, given the associated concentration risk. Lastly, Indian SMID stocks could face some headwinds in the near future.
For more actionable insights backed by data and analyses, we invite you to read the latest edition of Netra in its entirety
Industry insights you wouldn't want to miss out on.
Disclaimer
All content on this blog is the intellectual property of DSPAMC. The user of this site may download materials, data etc. displayed on the site for non-commercial or personal use only. Usage of or reference to the content of this page requires proper credit and citation, including linking back to the original post. Unauthorized copying or reproducing content without attribution may result in legal action. The user undertakes to comply and be bound by all applicable laws and statutory requirements in India.
This document is for information purposes only. The recipient of this material should consult an investment /tax advisor before making an investment decision. In this material DSP Asset Managers Pvt. Ltd. (the AMC) has used information that is publicly available, including information developed in-house and is believed to be from reliable sources. The AMC nor any person connected does not warrant the completeness or accuracy of the information and disclaims all liabilities, losses and damages arising out of the use of this information. Data provided is as on December 31, 2023 (unless otherwise specified and are subject to change without notice). Past performance may or may not be sustained in the future and should not be used as a basis for comparison with other investments. There is no assurance of any returns/capital protection/capital guarantee to the investors in above mentioned scheme. The portfolio of the scheme is subject to changes within the provisions of the Scheme Information document of the scheme. The statements contained herein may include statements of future expectations and other forward-looking statements that are based on prevailing market conditions / various other factors and involve known and unknown risks and uncertainties that could cause actual results, performance or events to differ materially from those expressed or implied in such statements.. The sector(s)/stock(s)/issuer(s) mentioned herein do not constitute any research report/recommendation of the same and the scheme/ Fund may or may not have any future position in these sector(s)/stock(s)/issuer(s). The strategy / investment approach / framework mentioned herein is currently followed by the scheme and the same may change in future depending on market conditions and other factors.
For complete details on investment objective, investment strategy, asset allocation, scheme specific risk factors and more details, please read the Scheme Information Document, and Key Information Memorandum of the scheme available on ISC of AMC and also available on www.dspim.com. For Index disclaimer click here. Large-caps are defined as top 100 stocks on market capitalization, mid-caps as 101-250 , small-caps as 251 and above. The strategy mentioned has been currently followed by the Scheme and the same may change in future depending on market conditions and other factors.
Mutual Fund investments are subject to market risks, read all scheme related documents carefully..


Write a comment